Your FinOps tool has a blind spot. It's called energy.
Antarctica measures it and finds the waste your invoice never shows.

"We spend millions every year on AWS and Azure. Every month the bill went up and nobody could tell us why. Antarctica gave us, for the first time, a real-time view of exactly which workloads were driving it."


limited visibility
AWS, GCP and Azure show service-level costs. Never what's consuming energy underneath.
invisible waste
Idle compute, oversized instances, unused storage, all unnoticed until the bill arrives.
estimated emissions
Your cloud provider's carbon data is a regional average. Not measured. Not auditable. Not defensible.
Your FinOps tool has a blind spot.
It's called energy.
Antarctica measures it and finds the waste your invoice never shows.
"We spend millions every year on AWS and Azure. Every month the bill went up and nobody could tell us why. Antarctica gave us, for the first time, a real-time view of exactly which workloads were driving it."

limited visibility
AWS, GCP and Azure show service-level costs. Never what's consuming energy underneath.
invisible waste
Idle compute, oversized instances, unused storage, all unnoticed until the bill arrives.
estimated emissions
Your cloud provider's carbon data is a regional average. Not measured. Not auditable. Not defensible.


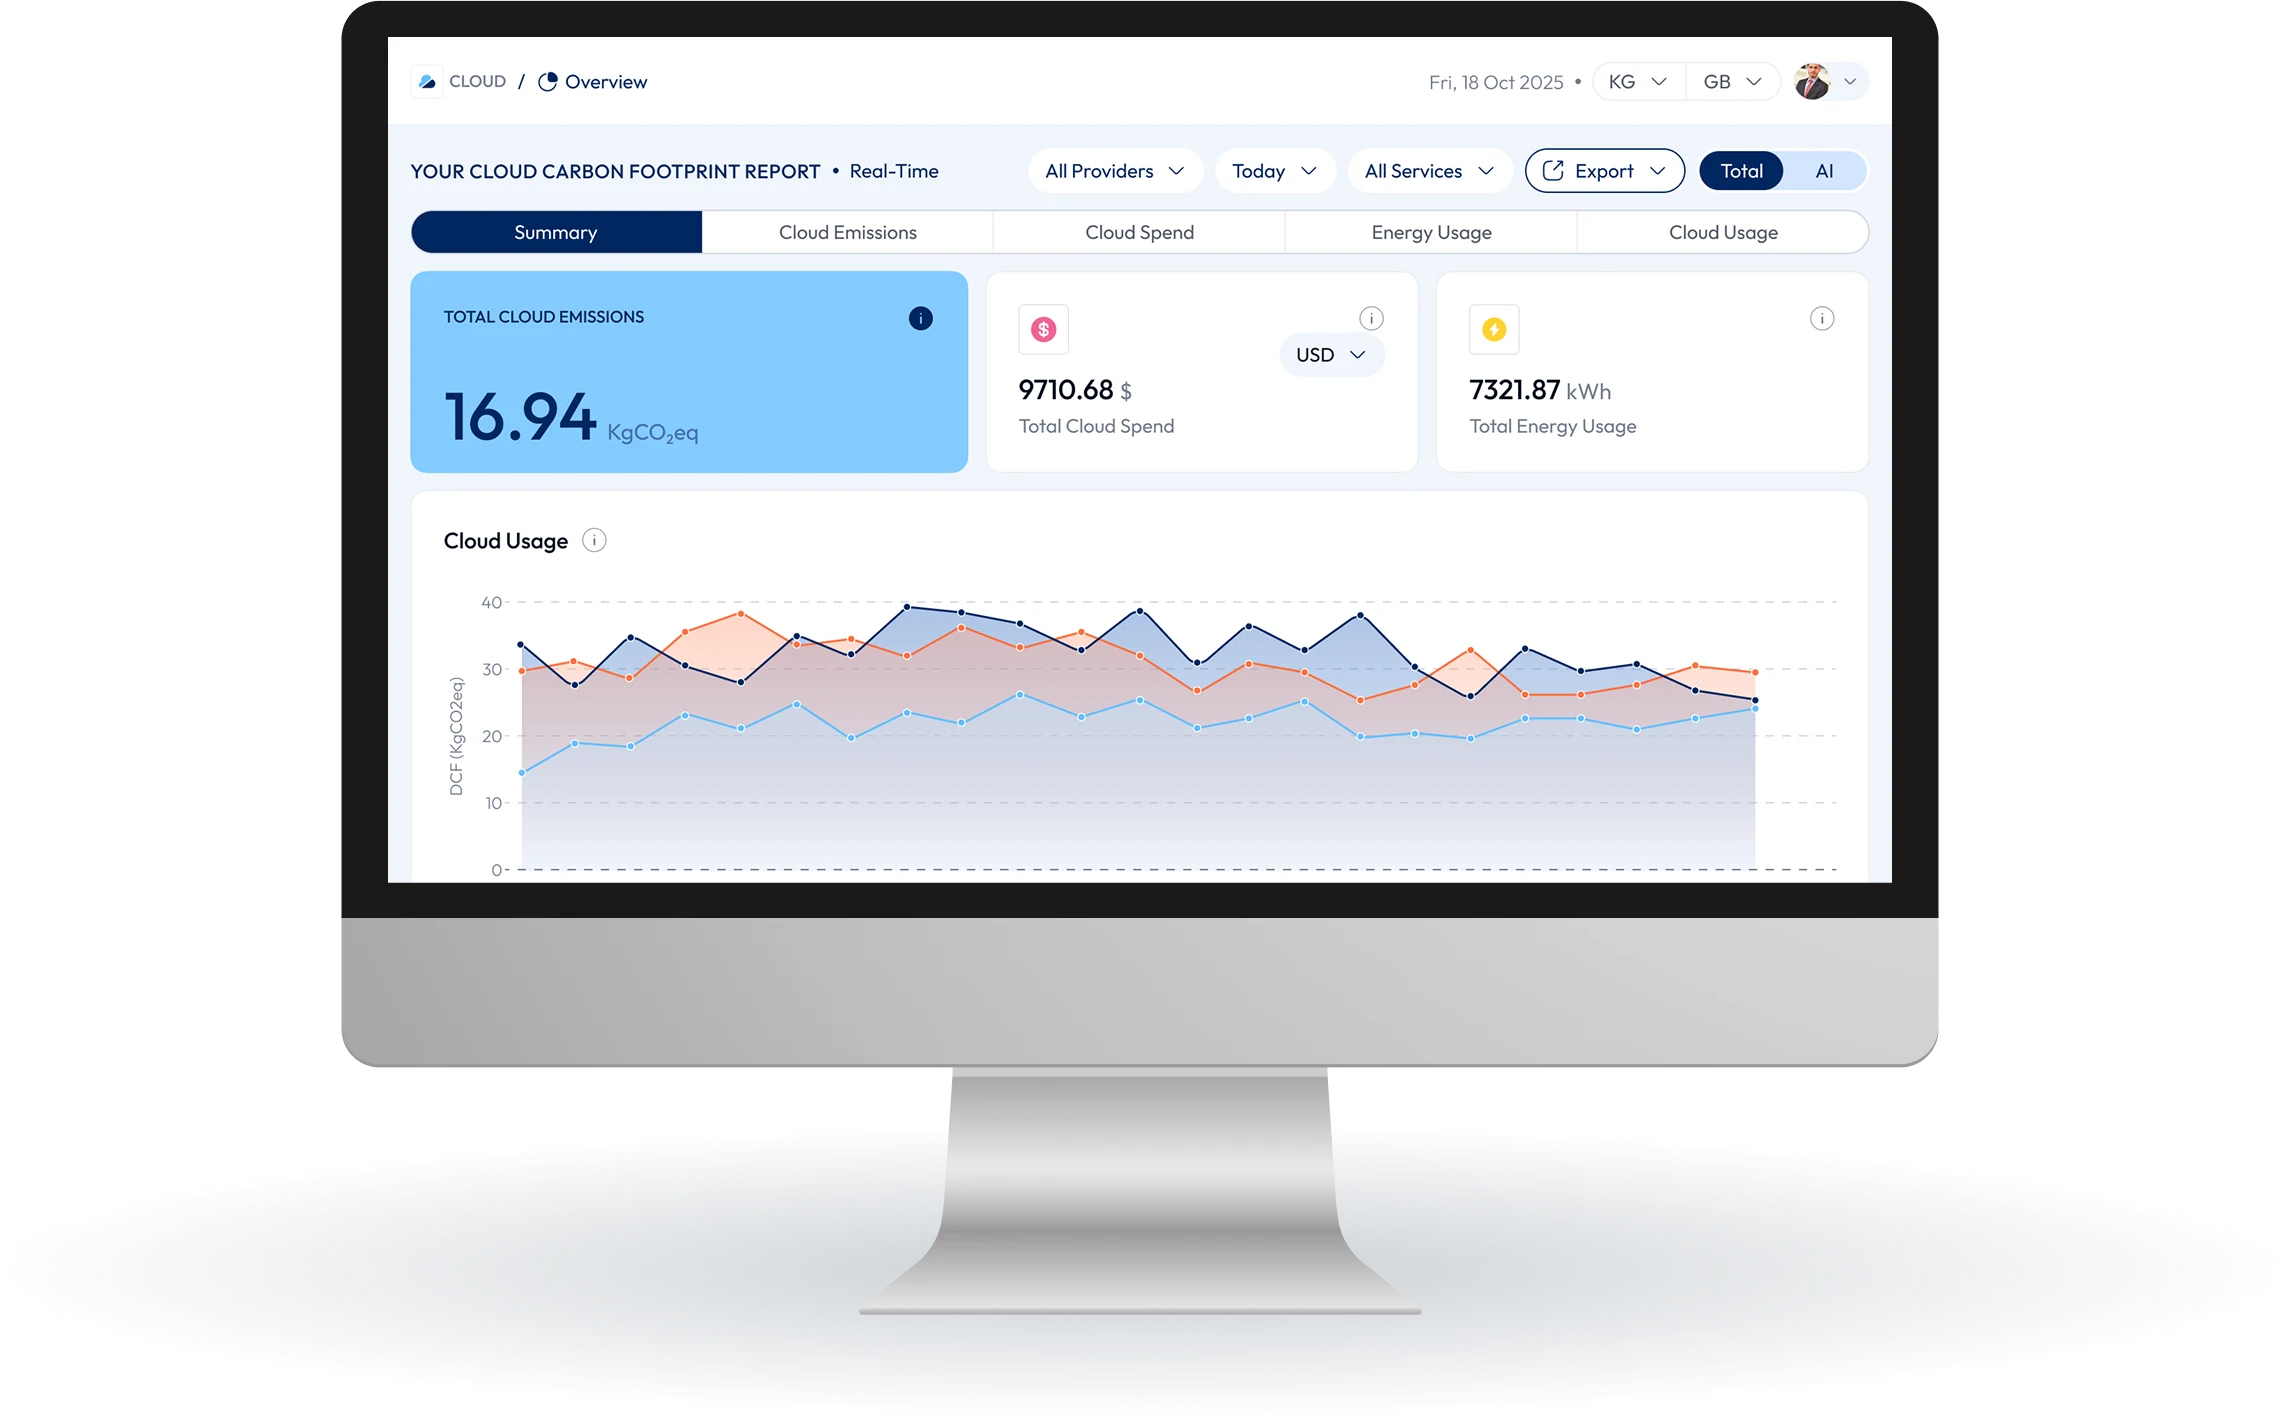
Your cloud data, organized by who needs it.
Financial, operational, and environmental intelligence, each stakeholder gets the view that drives their decisions.


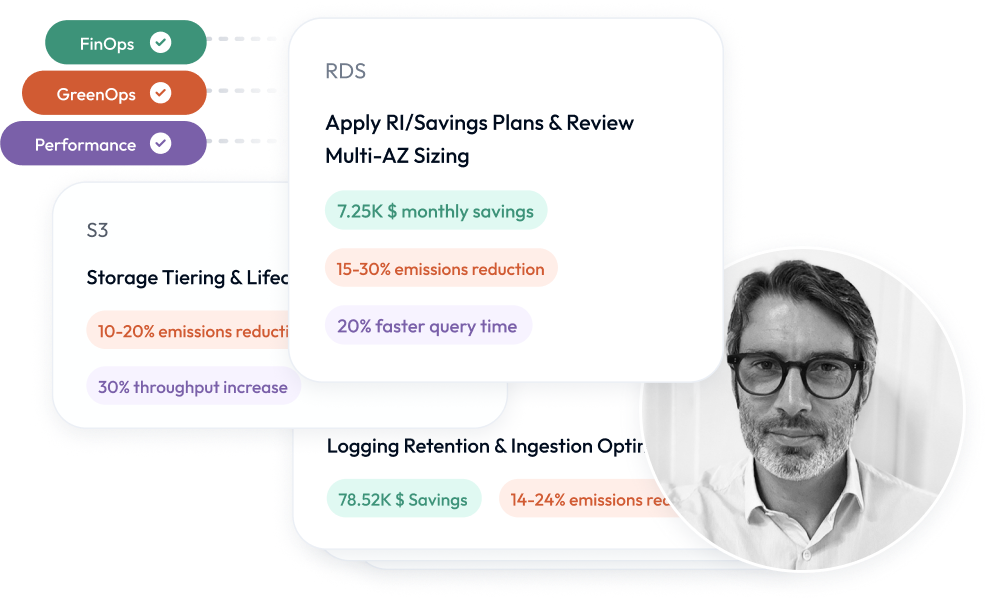
Antarctica surfaces prioritized FinOps and GreenOps recommendations , by workload, by cost impact, by emissions reduction.
"Within the first quarter, we reduced our cloud costs by nearly 25% while cutting emissions across all our services. The recommendations weren't generic best practices. They were specific to our infrastructure, ranked by impact. We knew exactly what to fix first."
Thibaut Mallet De Chauny
Director, EIS Network
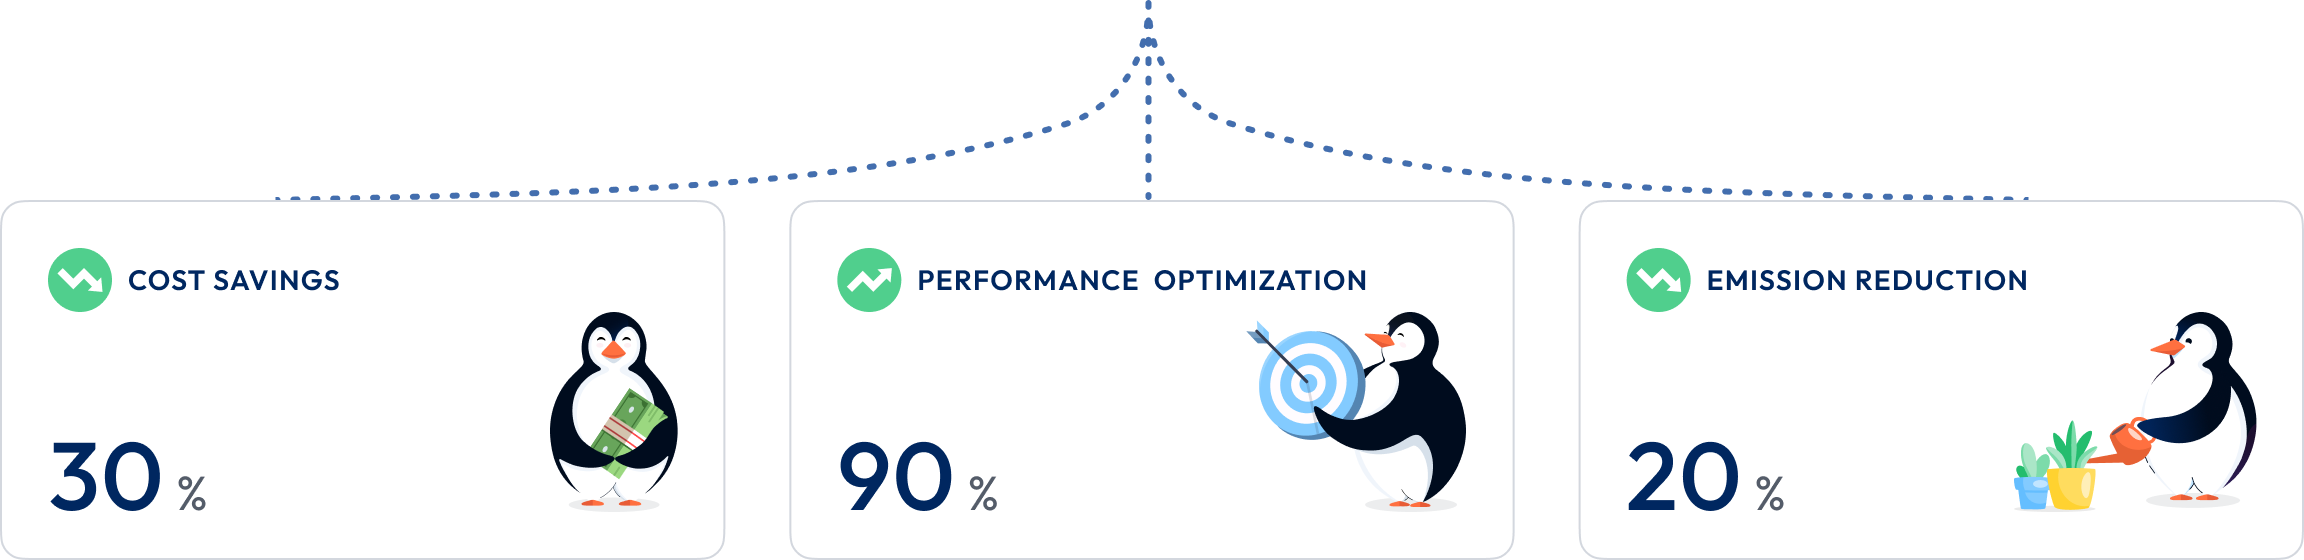
One platform. Three results.
Across cost, performance, and emissions.


Built for enterprise compliance
Trusted by enterprises for up-to-date, auditable cloud intelligence.

Export-ready data
Our cost, energy, and emissions metrics are aligned with SOC 2, ISO standards and the GHG Protocol.
Verified data lineage
Every metric is traceable from raw cloud billing data across AWS, Azure, and GCP to final reported insights.
Regulatory reporting support
Structured data outputs designed to support financial audits, ESG disclosures, and sustainability reporting requirements.


What makes Antarctica different
Most FinOps and GreenOps tools do one thing well. Antarctica does all of it.
Enterprise Problems
What is my cloud spend, usage, emissions, performance across AWS, Azure and GCP?

Unified dashboard

Three separate consoles
How do I see and detect anomalies?
Real-time anomaly alerts
Delayed by 24–72 hours
Am I overspending on un-utilized/idle resources?
100% cloud waste reduction
Partial visibility
Is my engineering team wasting time on cloud issues instead of go-to-market execution?
Allocation of every dollar to business need
Tech-business disconnect
What is my scope 3 cloud carbon footprint?
ISO & GHG aligned cloud energy model
Not transparent
How do I simplify my cloud financial planning?
Granular unit economics
Siloed financial state
How do I reduce my cloud bill annually?
Pro-active automated FinOps & GreenOps
Reactive optimization
Answers to your most critical questions on managing, optimizing, and governing cloud spend.
Most FinOps tools read from billing APIs and surface service-level costs. Antarctica enriches that data with energy-level measurement, giving you instance and workload-level attribution that billing data alone cannot provide. That is where the waste your current tool misses is hiding.
Antarctica clients typically identify addressable waste within the first two weeks of deployment. Measurable cost reduction follows within the first quarter, with an average of 20% cloud cost savings in the first year.
Yes. Because Antarctica tracks consumption in real time at the workload level, your finance and infrastructure teams can model spend trajectories before they hit the invoice, not after.
Antarctica complements and extends your existing FinOps stack. It does not require you to rip and replace. It integrates with your CUR and existing billing exports and adds the layer of intelligence they cannot produce on their own.
Antarctica supports AWS, Azure, and Google Cloud, with unified cost attribution across all three in a single view.